- Home
- BLOG
- Instagram Marketing
- 7 Key Instagram Statistics You Need to Track in 2021
There’s no denying that Instagram today is a highly competitive environment. And it’s virtually impossible to succeed on the platform unless you analyze your performance. That’s where Instagram statistics come in, in the form of the Instagram Insights feature that launched back in 2016.
Sure, this relatively new feature for business accounts might not be as effective and detailed as many off-platform tools. However, it still offers a solid picture of your basic profile metrics. This means Instagram statistics deserve more attention. So let’s shed some light on Instagram Insights and what it is about.
What are Instagram statistics?
Instagram profile statistics commonly known under the name of Instagram Insights is the platform’s native analytics tool. It collects and compiles data on your audience demographics, follower actions, and content performance. This information is very helpful when it comes to comparing the performance of different content formats or evaluating the performance of marketing campaigns and promotions. Besides, it offers a good idea of how your separate pieces of content perform compared to others.
This helpful tool helps you to have a better understanding of your audience and the kind of content they want to see on your feed.
It’s worth noting that to get access to Instagram Insights, you have to have a Business account. Thankfully, you can do that in a few seconds and free of charge.
How to view Instagram account insights
First of all, make sure your account is switched to the Business version. If it’s not, go to your account menu (the three horizontal lines pictogram at the top right corner of your profile page). Choose Settings, then Account, then scroll to the bottom of the screen to choose Switch to a Business account. Link your Instagram account to your Facebook profile and it’s done, now you can easily access Insights.
To do this, go to your account menu again. You will now see the Insights option. Tap it to view your account stats.
Keep in mind that you will only be able to view your profile statistics starting from the day you switched to a Business account. If you ever decide to switch back to a regular account, all statistics data will be lost.
Instagram Insights
Once you choose Insights in your menu, you’ll be able to view your profile statistics. This information is divided into three sections, Content, Activity, and Audience.
Content
Here you can see information on all content you’ve posted during the last week. In the case of Stories, it’s the last 24 hours. The app compares your content performance this last week to that of the previous one. This information gets updated at the end of every week.
Thankfully, there is an option See All that allows viewing content stats during the entire period of your activity, from the last seven days to the first post you ever published, depending on when you converted your profile to Business. You can also view insights on different content formats (photos, videos, galleries, promotions, etc.)
So how is this beneficial to you? The thing is thanks to this data, you get a better understanding of what topics and content formats evoke the most vivid response from your audience. And of course, which ones they don’t care about at all.
Another useful metric you can find here is Promotions. It’s extremely helpful to those who plan to set up and launch targeted ads. All information on your profile promotions is stored here, including the ads that were rejected by the support team. You can edit them and launch them once again.
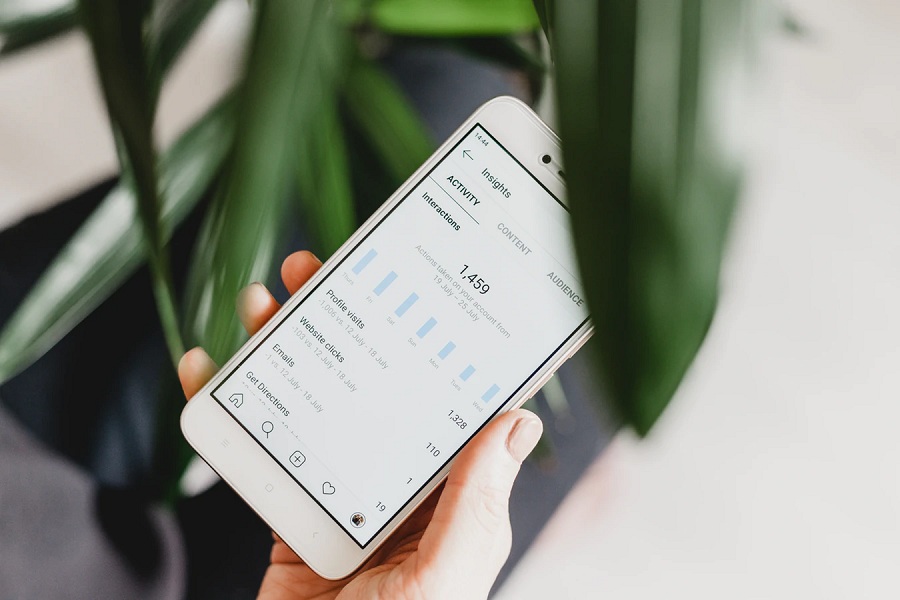
Activity
There are only two metrics to view here, Discovery and Interactions.
Discovery allows seeing how many views your posts got in general and how many unique users viewed them in particular. In short, it gives you information on your content impressions and reach.
The app displays your general content reach and your daily reach in the form of a graph. By tapping the graph, you’ll be able to see your reach numbers for every day of the last week. You can use this information when planning your content strategy and posting schedule.
Interactions include info on:
- profile visits (how many people visited your profile after seeing your posts on the main feed); and
- website clicks (how many people clicked on the link in bio to go to your website.
All this information allows you to understand how effective your promotion methods are and how effective your profile is in terms of generating leads. If you have many followers but your reach numbers are low, you should better get rid of all the fake followers. If your reach is off the charts but there are few profile visits, it might mean that people don’t find your content interesting.
Audience
Obviously, it’s here that you can analyze your audience and tweak your content according to its interests.
The Growth metric offers data on new followers, as well as those who unfollowed you. Here you can also view the ratio between followers and unfollowers. The Top locations metric shows the places the majority of your followers are from. This is where you can evaluate the effectiveness of your targeted ad campaigns.
Another metric is Gender; it shows the ratio between male and female followers. And Followers shows the hours and days of your audience’s highest/lowest activity. Thanks to this useful piece of information, you can better plan your publication schedule to make sure your content will be viewed by as many of your followers as possible.
trendHERO stats
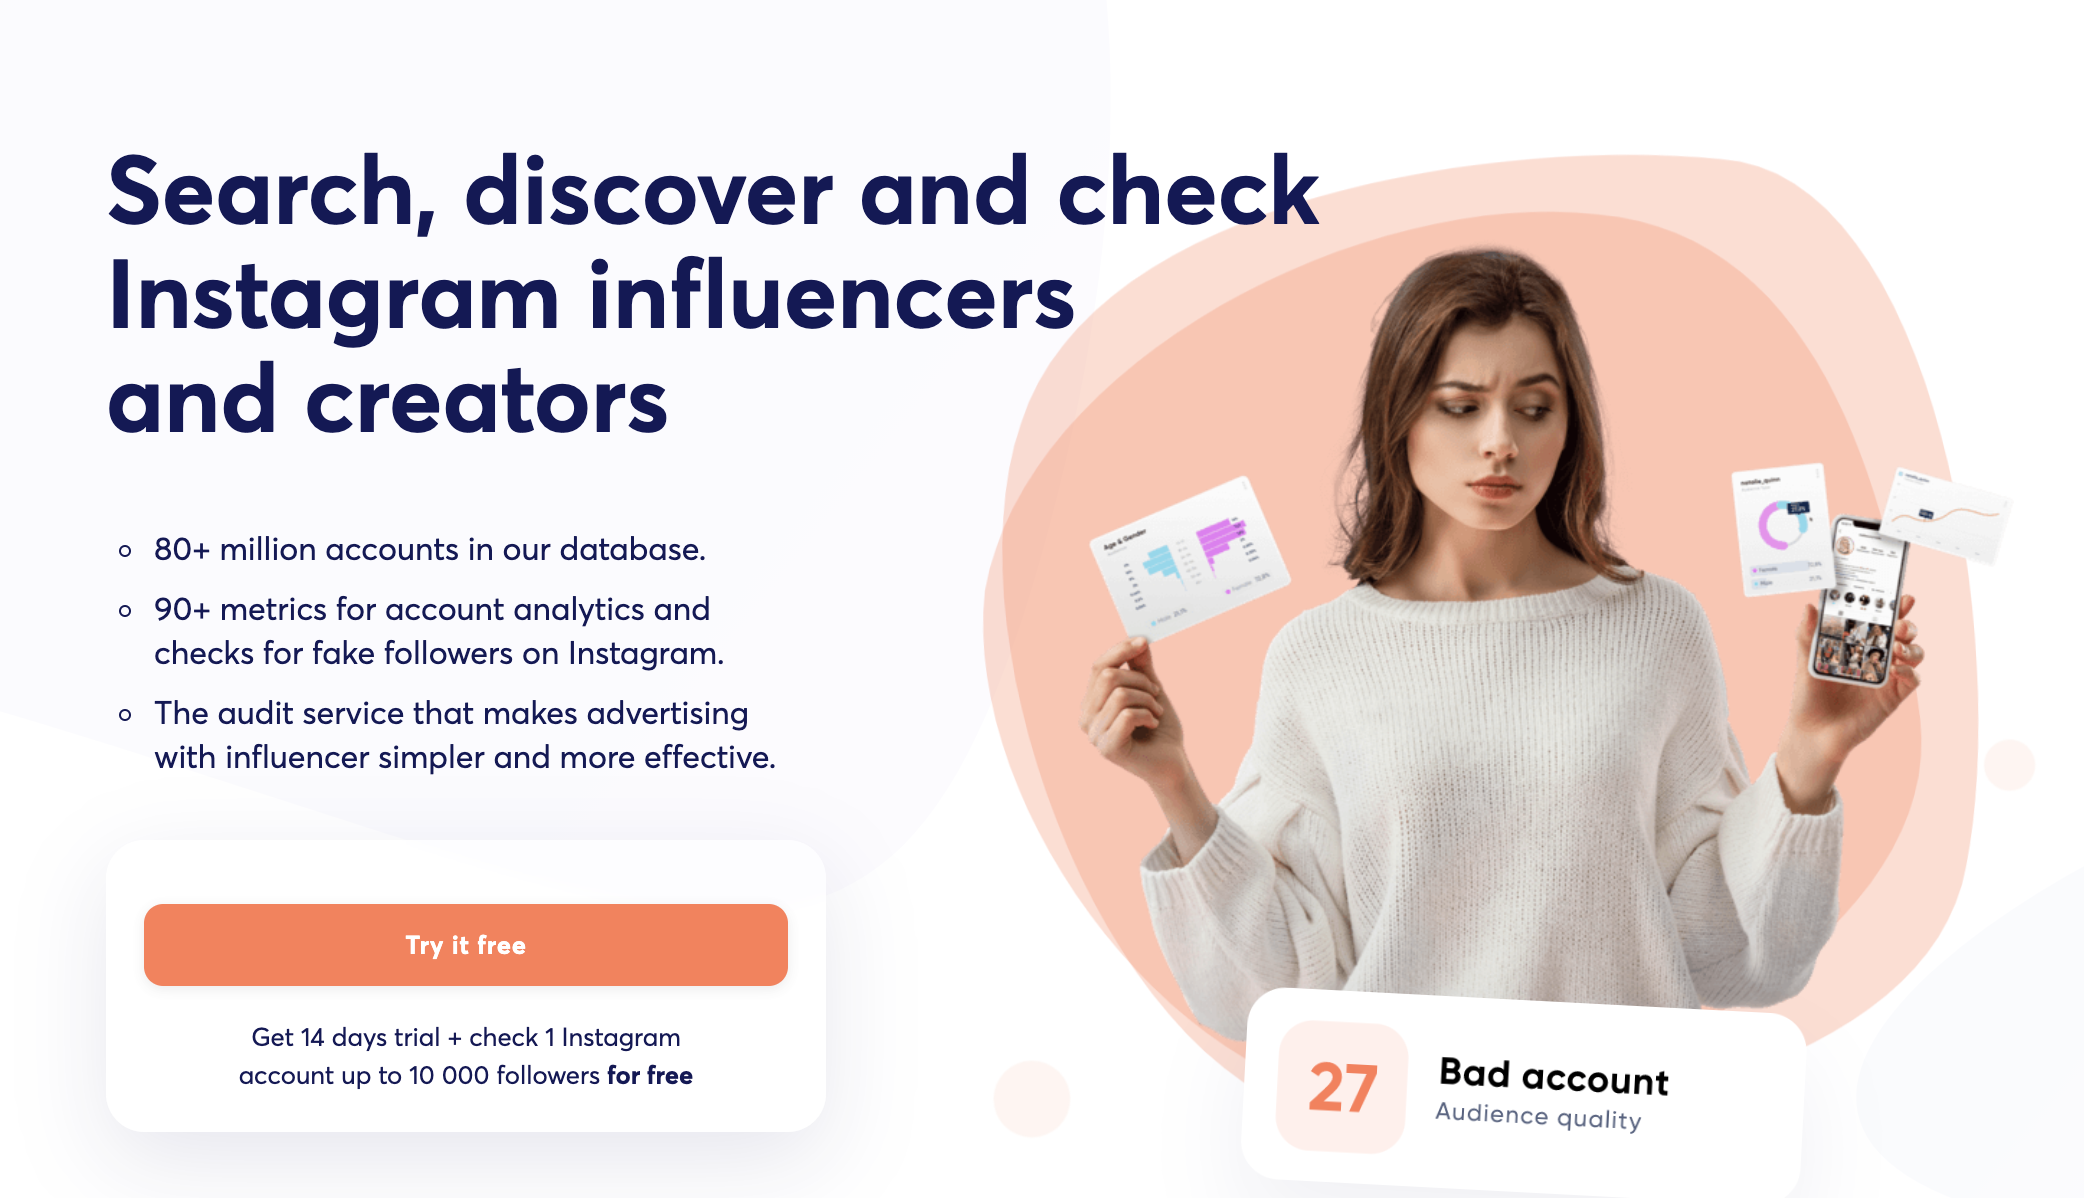
As you can see, Instagram Insights offer a very basic idea of what is going on on your profile and why. trendHERO takes Instagram statistics to the next level and offers detailed information on the most important profile metrics.
Engagement rate
Unlike Instagram Insights, trendHERO calculates and displays ER for every Instagram profile report. This is one of the most important metrics because it shows how interested your audience is in your content.
Audience
Audience analysis is crucial if you plan to grow on the platform and increase your brand awareness, leads, and sales. trendHERO understands that, which is exactly why the service offers an extremely detailed report on your Instagram audience.
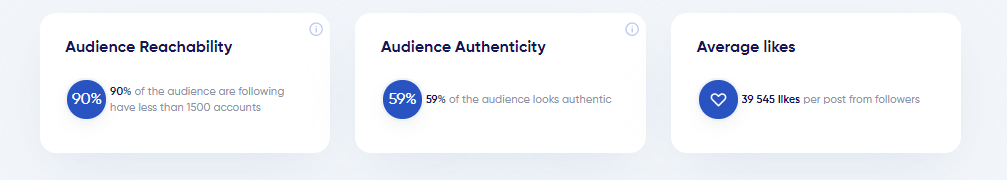
Audience authenticity, reachability, and average number of likes
Audience reachability shows the percentage of followers that follow less than 1500 profiles. This is important because if a user follows more profiles than that, it means that their feed is overloaded with all kinds of publications. And this in its turn means that they are very unlikely to see your content, whether it’s regular publications or promotions.
Audience authenticity shows the percentage of real followers (meaning personal profiles and commercial accounts). This metric matters because real people and not fake followers are what’s really important to marketers. Fake followers will have no interest in what they have to offer.
Average likes metric shows how active your audience is.
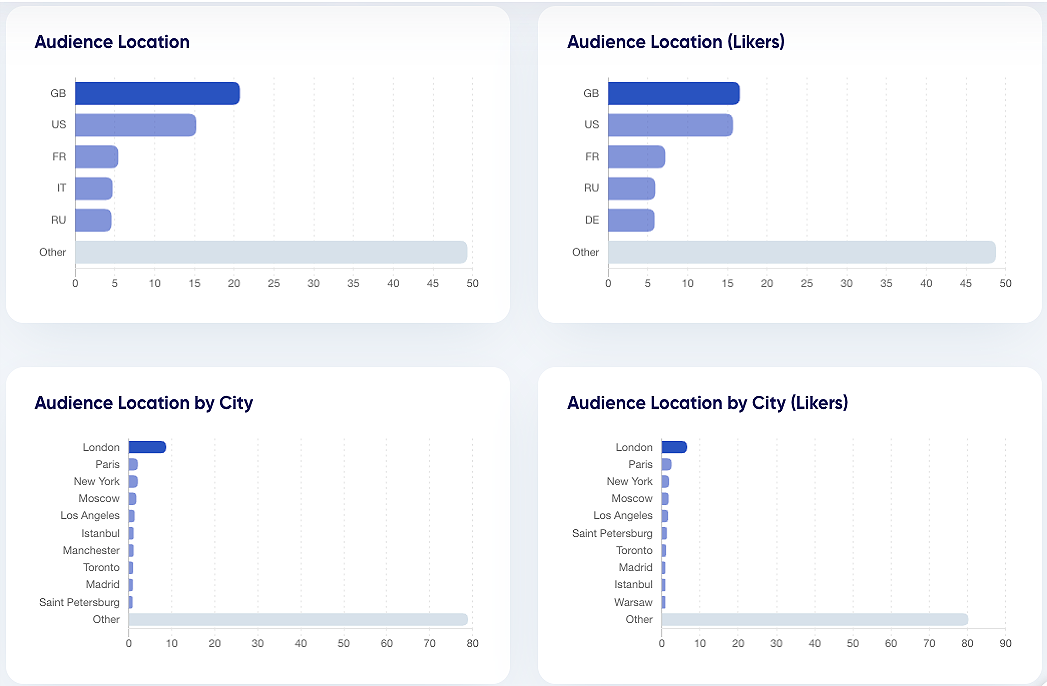
Audience location
Just like Instagram Insights, the service offers general information on the locations where the majority of your followers live. However, it significantly expands on that info by showing the locations where the majority of your likers live and also displaying not only top cities but top countries.
Why does this matter? Because great discrepancies between your followers’ location and likers’ location are usually a sure sign of inauthentic following.
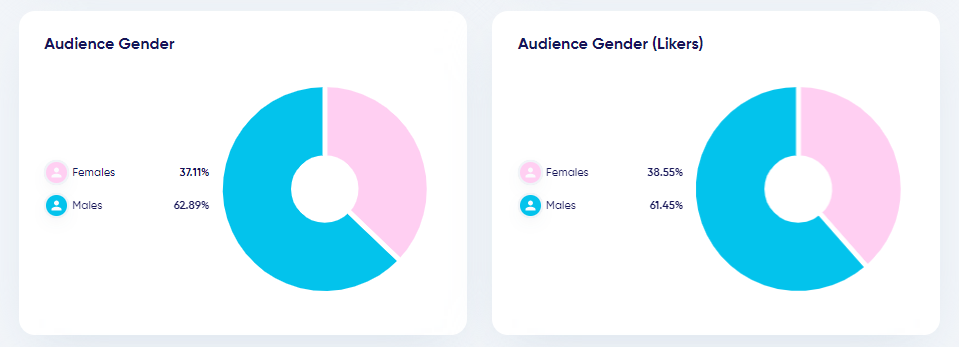
Audience gender
Knowing your followers’ gender ratio, you can plan and correct your content strategy accordingly.
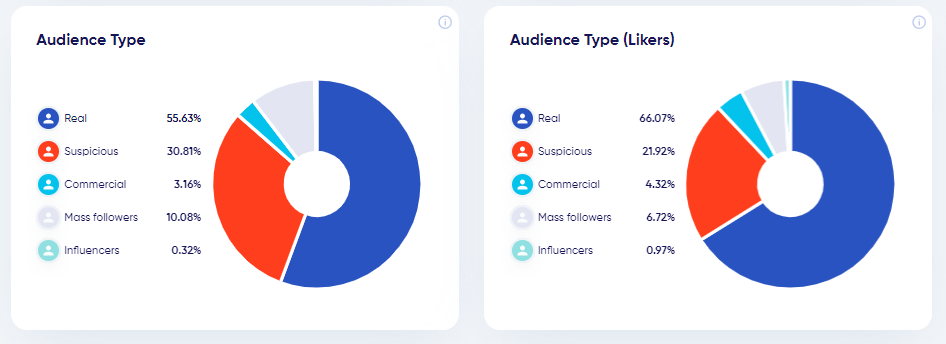
Audience type
This is something Instagram Insights doesn’t show you. This piece of statistics shows the percentage of authentic followers, commercial accounts, and suspicious profiles. It’s worth paying special attention to the ratio between suspicious accounts (bots and empty profiles) and mass followers and real people.
This matters to both content creators and marketers a great deal. As a content creator, you need more people to be interested in your content. As a marketer, you need more people to be interested in your products. If the number of mass followers and suspicious accounts is too high, your growth on the platform will be non-existent and your marketing budget wasted.
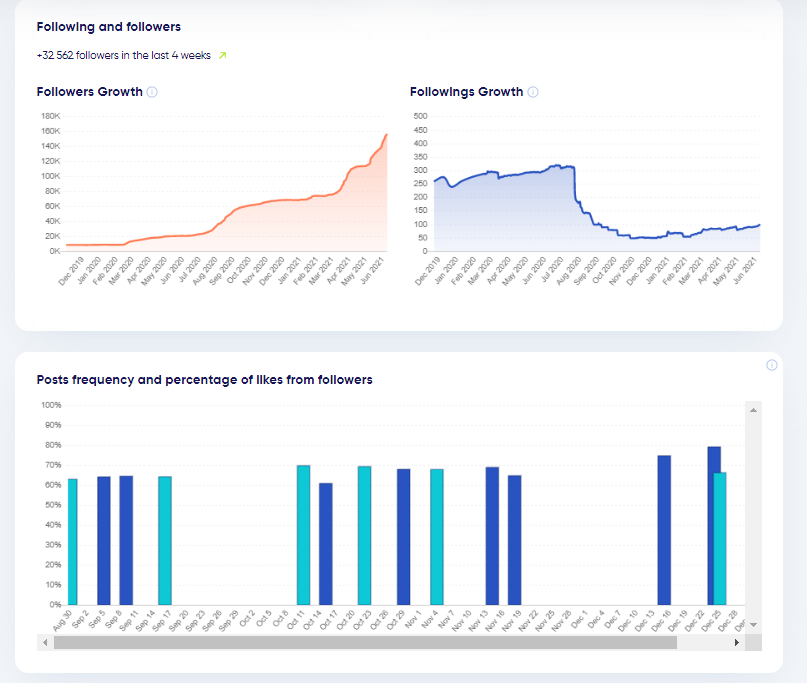
Followers
The service displays information on the following and follower growth and the ratio between publication frequency and likes. This data matters for several reasons:
- When your follower growth slows down or stops, you can find the reason and fix the problem.
- Sudden spikes in follower growth can indicate the acquisition of a large number of fake followers. It might also be the sign of certain events like giveaways but more often than not it’s a red flag.
- The percentage of likes received from followers might show inauthentic activity like mass liking.
Comments
Comments by type
This is a small graph that offers a wealth of impactful information:
- You can have an idea about how many suspicious comments a profile owner gets. Too many short and suspicious comments might indicate inauthentic activity (mass commenting). Bots and people who were paid to comment aren’t interested in leaving meaningful comments.
- You can see the level of interaction between the profile owner and their audience. A large percentage of author’s comments might mean they frequently engage in discussions with their followers and answer their comments and questions. This increases follower engagement and loyalty.
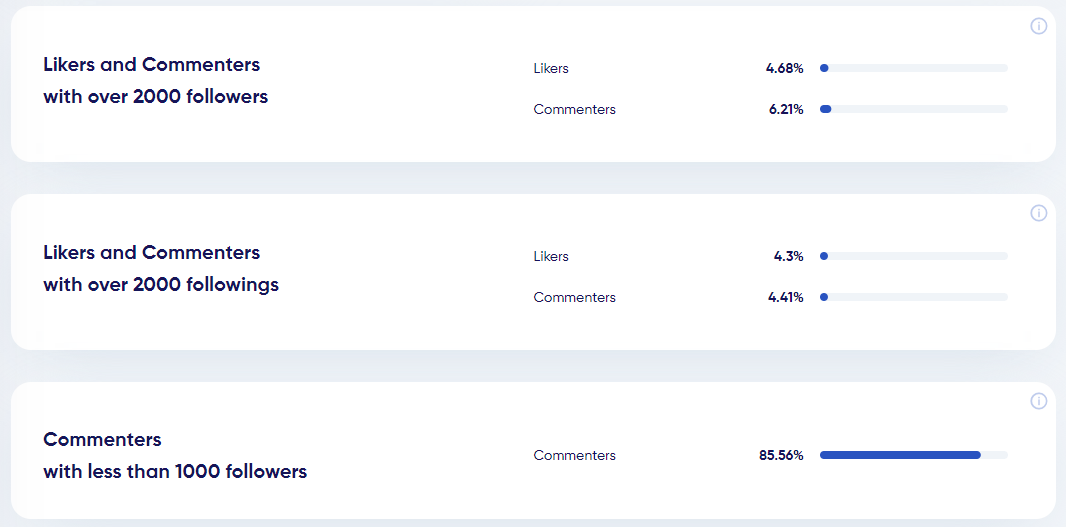
Likers and commenters and the number of their followers and followings
It’s likely that those among likers and commenters who have over 2000 followers are also content creators and influencers. This might give you more options for collaborations. But if the percentage of these likers and commenters is too high, there’s a possibility of influencers helping each other out by commenting and liking each other’s posts.
Likers and commenters with over 2000 followings are likely mass followers. The more of these there are, the less effective your marketing campaign will be.
Finally, commenters with less than 1000 followers are real people and their engagement is as authentic as it gets.
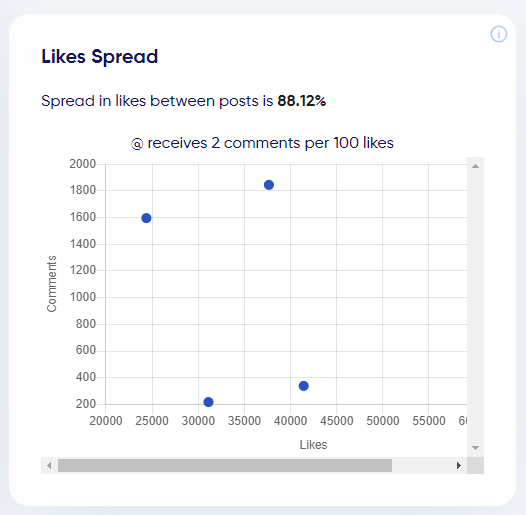
Likes distribution
This metric shows the ratio between the number of posts and the number of likes and comments. Any values between 40% and 100% are within the norm but a value under 40% indicates mass liking/commenting and a value over 100% indicates an event (challenge or giveaway) post or the fact that a post was promoted.
Profile mentions
This metric displays Instagram profiles most frequently mentioned by the profile owner. They are not necessarily sponsored posts (even though they often are) and can give you some idea of who they collaborate with and how.
7 most important Instagram profile statistics to track in 2021
Metrics tracking and optimization is one of the most effective instruments of promotion on Instagram. Here are the most impactful metrics that matter in 2021.
1. Engagement rate
Engagement rate is one of the most important metrics to track on your Instagram profile. Its engagement rate largely impacts your posts and Stories ratings. This means that the higher your ER is the more visibility your content gains.
Content quality, your willingness to interact with your followers, the frequency of interactive content, competent use of UGC are all things that can positively (and organically) affect your engagement rate. However, avoid any inauthentic methods of increasing engagements (likes, comments, views). They can make your ER drop dramatically.
You can calculate your ER using one of the formulas available but the easiest way is to use analytics services like trendHERO that will do it for you.
2. Follower to following ratio
This is another metric you should pay special attention to. If there are more people that unfollow you than new followers, you risk getting shadowbanned which means your content will vanish from the main feed. At the same time, the increase in followers shouldn’t be too abrupt. The Instagram algorithm considers that as inauthentic activity (and let’s admit it, in most cases, it is).
3. Number of suspicious accounts among followers
These include bots, mass followers, inactive and empty profiles. The more of this kind of followers you’ve got the lower your engagement rate is. This means that a profile like this is extremely unattractive to all kinds of marketers.
4. Reach
Reach is the number of unique profile visitors who viewed your content. Track this metric to measure the size of the audience that sees your posts on the main feed. If it’s too low, take active measures to increase it: try new content formats, more interactive events, challenges, Q&As, contests, etc.
5. Conversion rate
Conversion is any desired action performed by a user. If you have a website, it’s the number of times they clicked on a link in your posts to visit it, for example. If you are a content creator, your conversion rate is the number of times they click on links in your promotions to visit your profile. The main thing here is to set correct goals, track this metric, and optimize it.
6. Profile mentions
One of the main goals for anyone who wants to grow on Instagram is to make your profile more recognizable. That’s why it would make sense to do everything you can to make other platform users tag you in their posts and Stories. This is how you raise brand awareness and boost your follower growth. Motivate your users to produce UGC and share it, collaborate with influencers.
7. Audience demographics
Spend as much time as you can learning more about your audience. Knowing your target audience helps to shape and organize an effective promotion strategy. Analyze such metrics as gender, age, location, follower activity and adapt your content strategy accordingly.
Conclusion
Whether it’s Instagram Insights or trendHERO analytics, Instagram profile statistics are a treasure trove of valuable information. They can do so much: help you boost your profile growth and create engaging content, make your marketing campaigns successful, and your influencer collaborations effective. Explore your Instagram statistics as much as you can and you’ll see your efforts pay off shortly.
We also recommend to read
 How to Track Instagram Follower Growth in 2022
  5 Essential Instagram Metrics to Start Tracking Today
  35+ Best Tools for Instagram Bloggers to Skyrocket a Blog in 2023
  How to Get Influencers to Share Your Content
  How to Create An Influencer Outreach Strategy in 7 Easy Steps
  What Is Brand Advocacy and How to Use It
Copyright © 2019-2023. All rights reserved.